

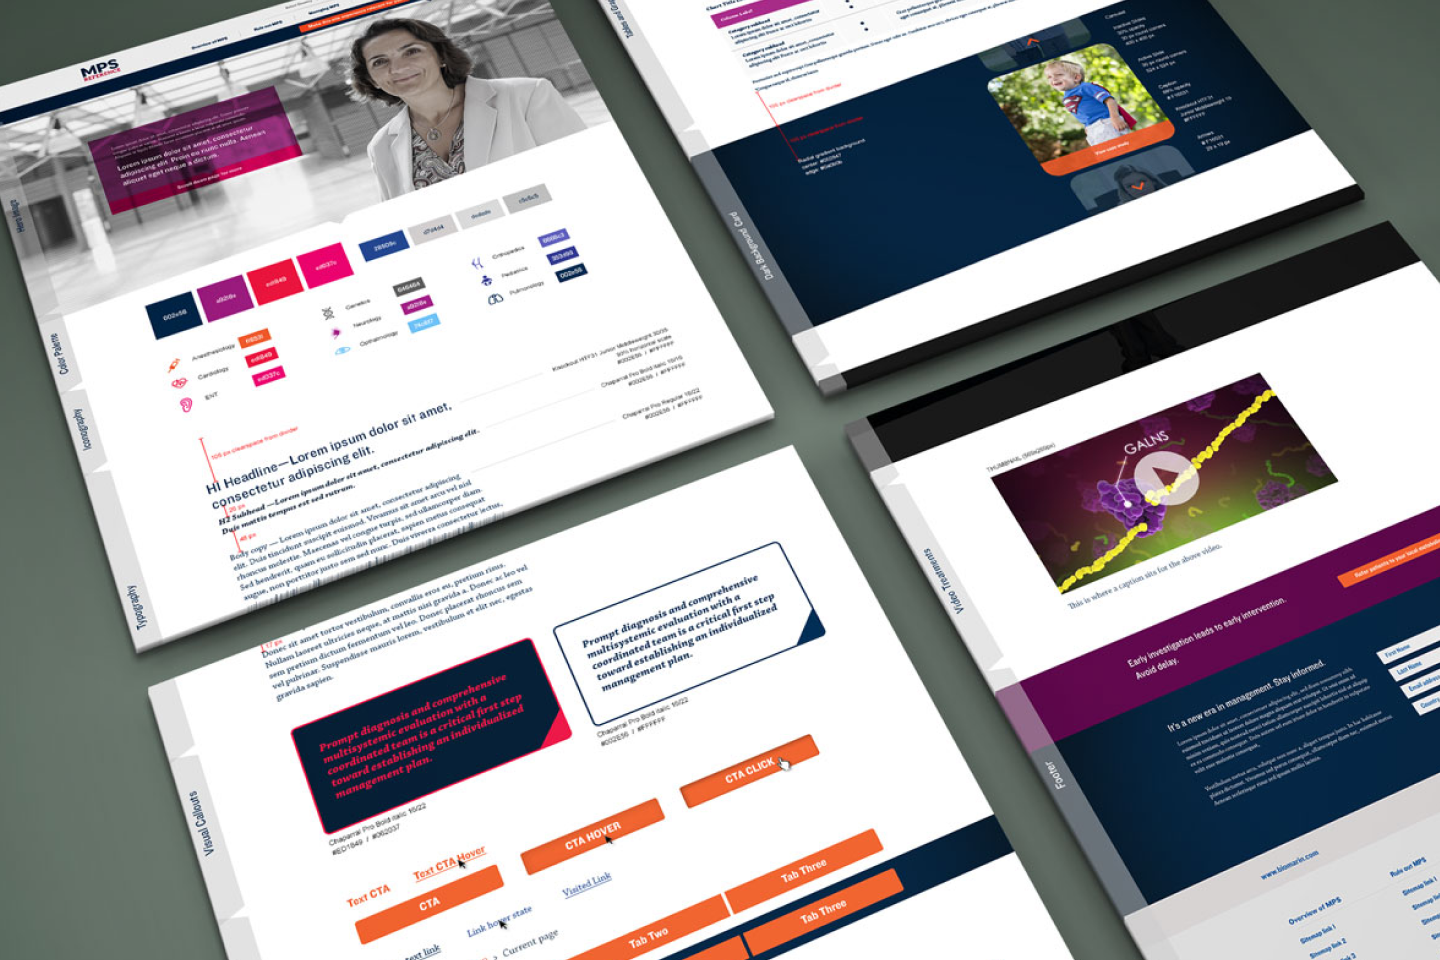
One visual system for a rare, complex disease
Every page of MPS Reference is built from four parts. Each one has a job beyond looking good: helping a clinician find, compare and trust what they're reading.
01 · The problem
Critical rare disease data was buried in text and tables.
Clinicians couldn't see the pattern for the paragraphs.
Clinicians, researchers and caregivers needed a reliable way to interpret mucopolysaccharidosis (MPS) data, but the existing reference material was fragmented, text-heavy and hard to scan. MPS is often mistaken for other conditions, so this data is consulted in clinical and research settings where reading it slowly, or wrongly, delays a diagnosis.
02 · Role and constraints
Accuracy first, aesthetics second, for a small audience that can't afford to misread.
What I owned
The site's visual and UX design: the style guide, information hierarchy, data visualization standards, responsive behavior and a visual language built for clarity and contrast. I worked with subject matter experts on clinical accuracy and with developers on feasibility as new data sets were added.
Highly specialized content
MPS data is complex, unfamiliar to non-specialists and easy to misread. Every visual decision had to protect the meaning of the data.
A small, expert audience
A narrow but critical group of readers. The design had to respect expert workflows while staying approachable for caregivers.
Dense data on every device
Desktop research sessions had to survive on a phone, where screen space and attention are both limited.
03 · Key decisions
Three questions shaped the system.
How do you keep charts from needing instructions?
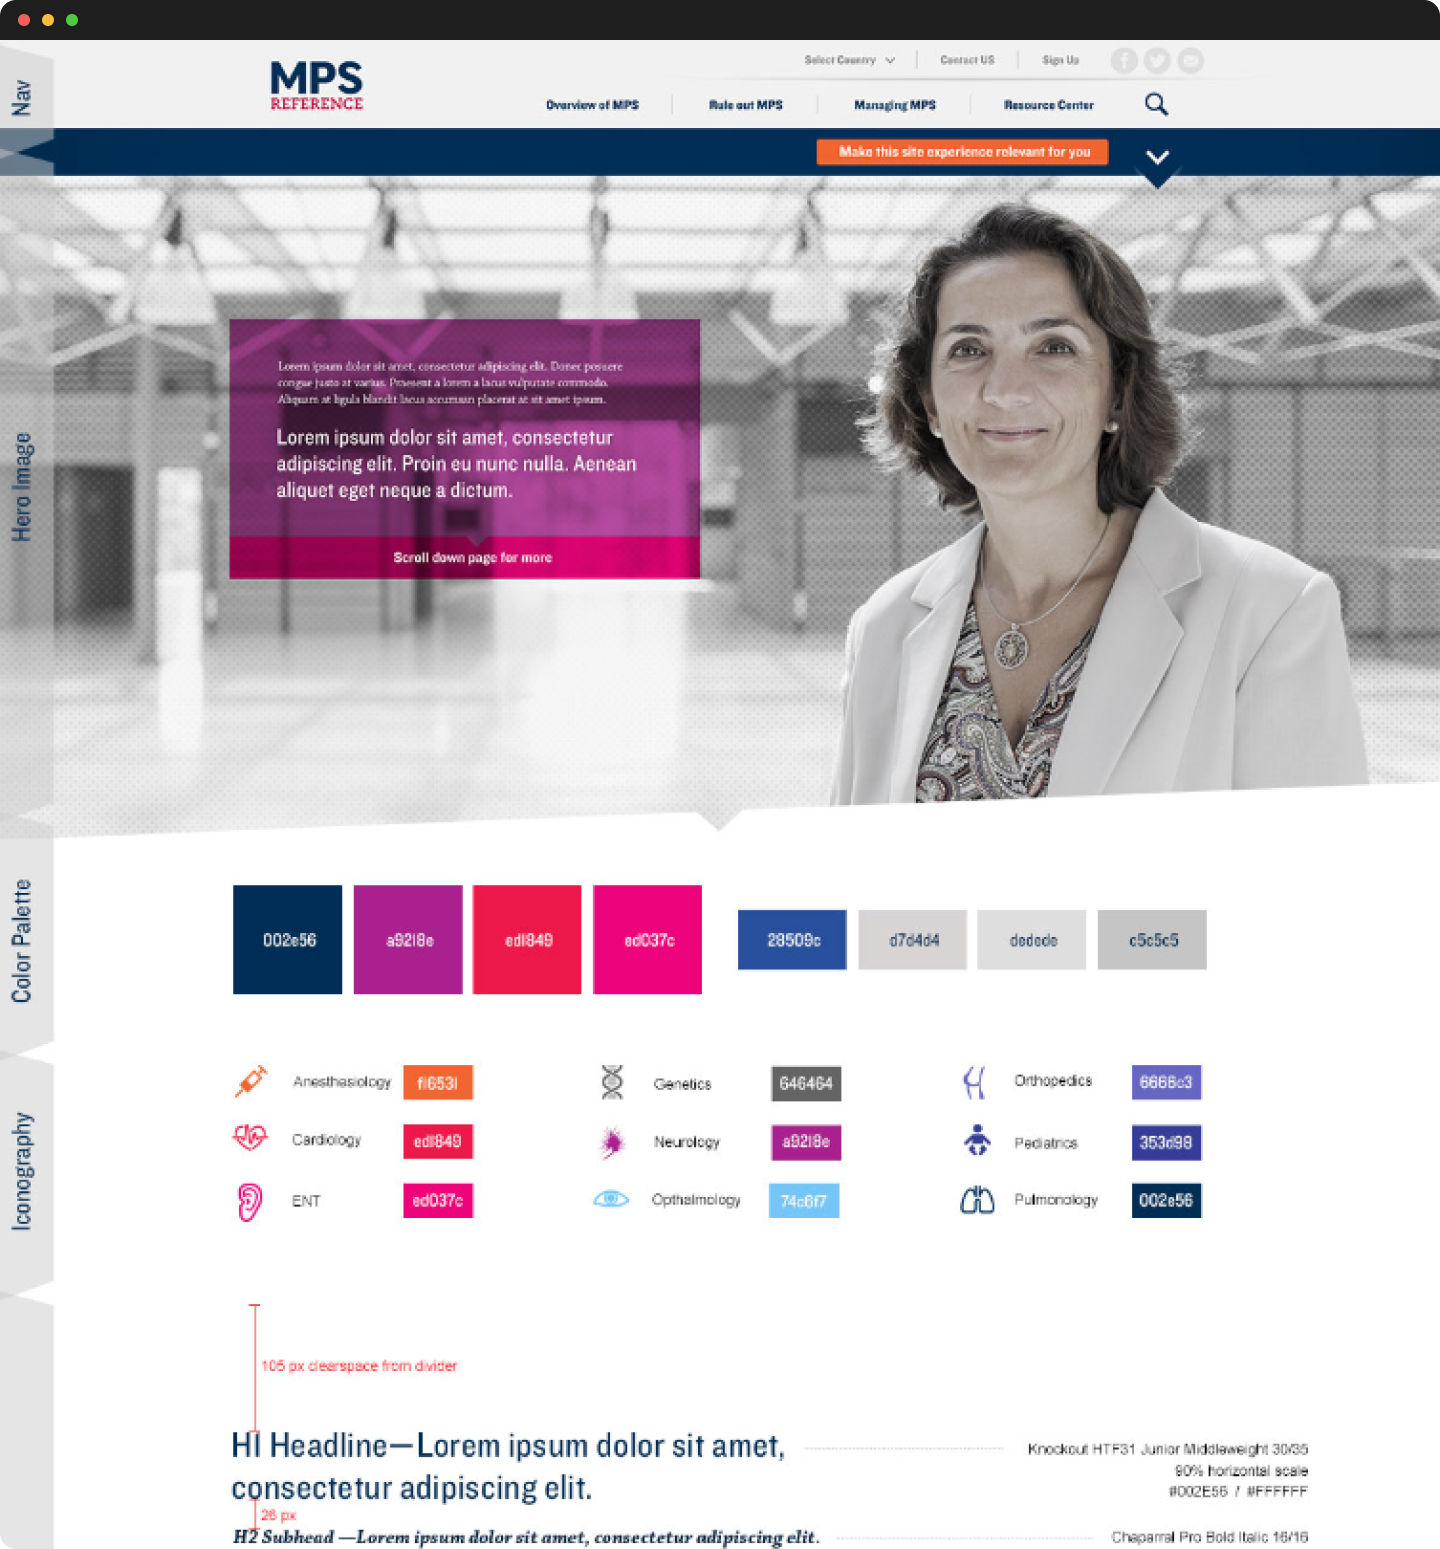
I wrote one set of rules for every chart and table: chart titles in Chaparral Pro Bold Italic, navy for the primary plot and red for the secondary, a near-white chart background and gray axis labels. Once someone learns to read one chart, they can read the rest.
Learn to read one chart, and you can read them all.
Should charts support the text, or be the interface?
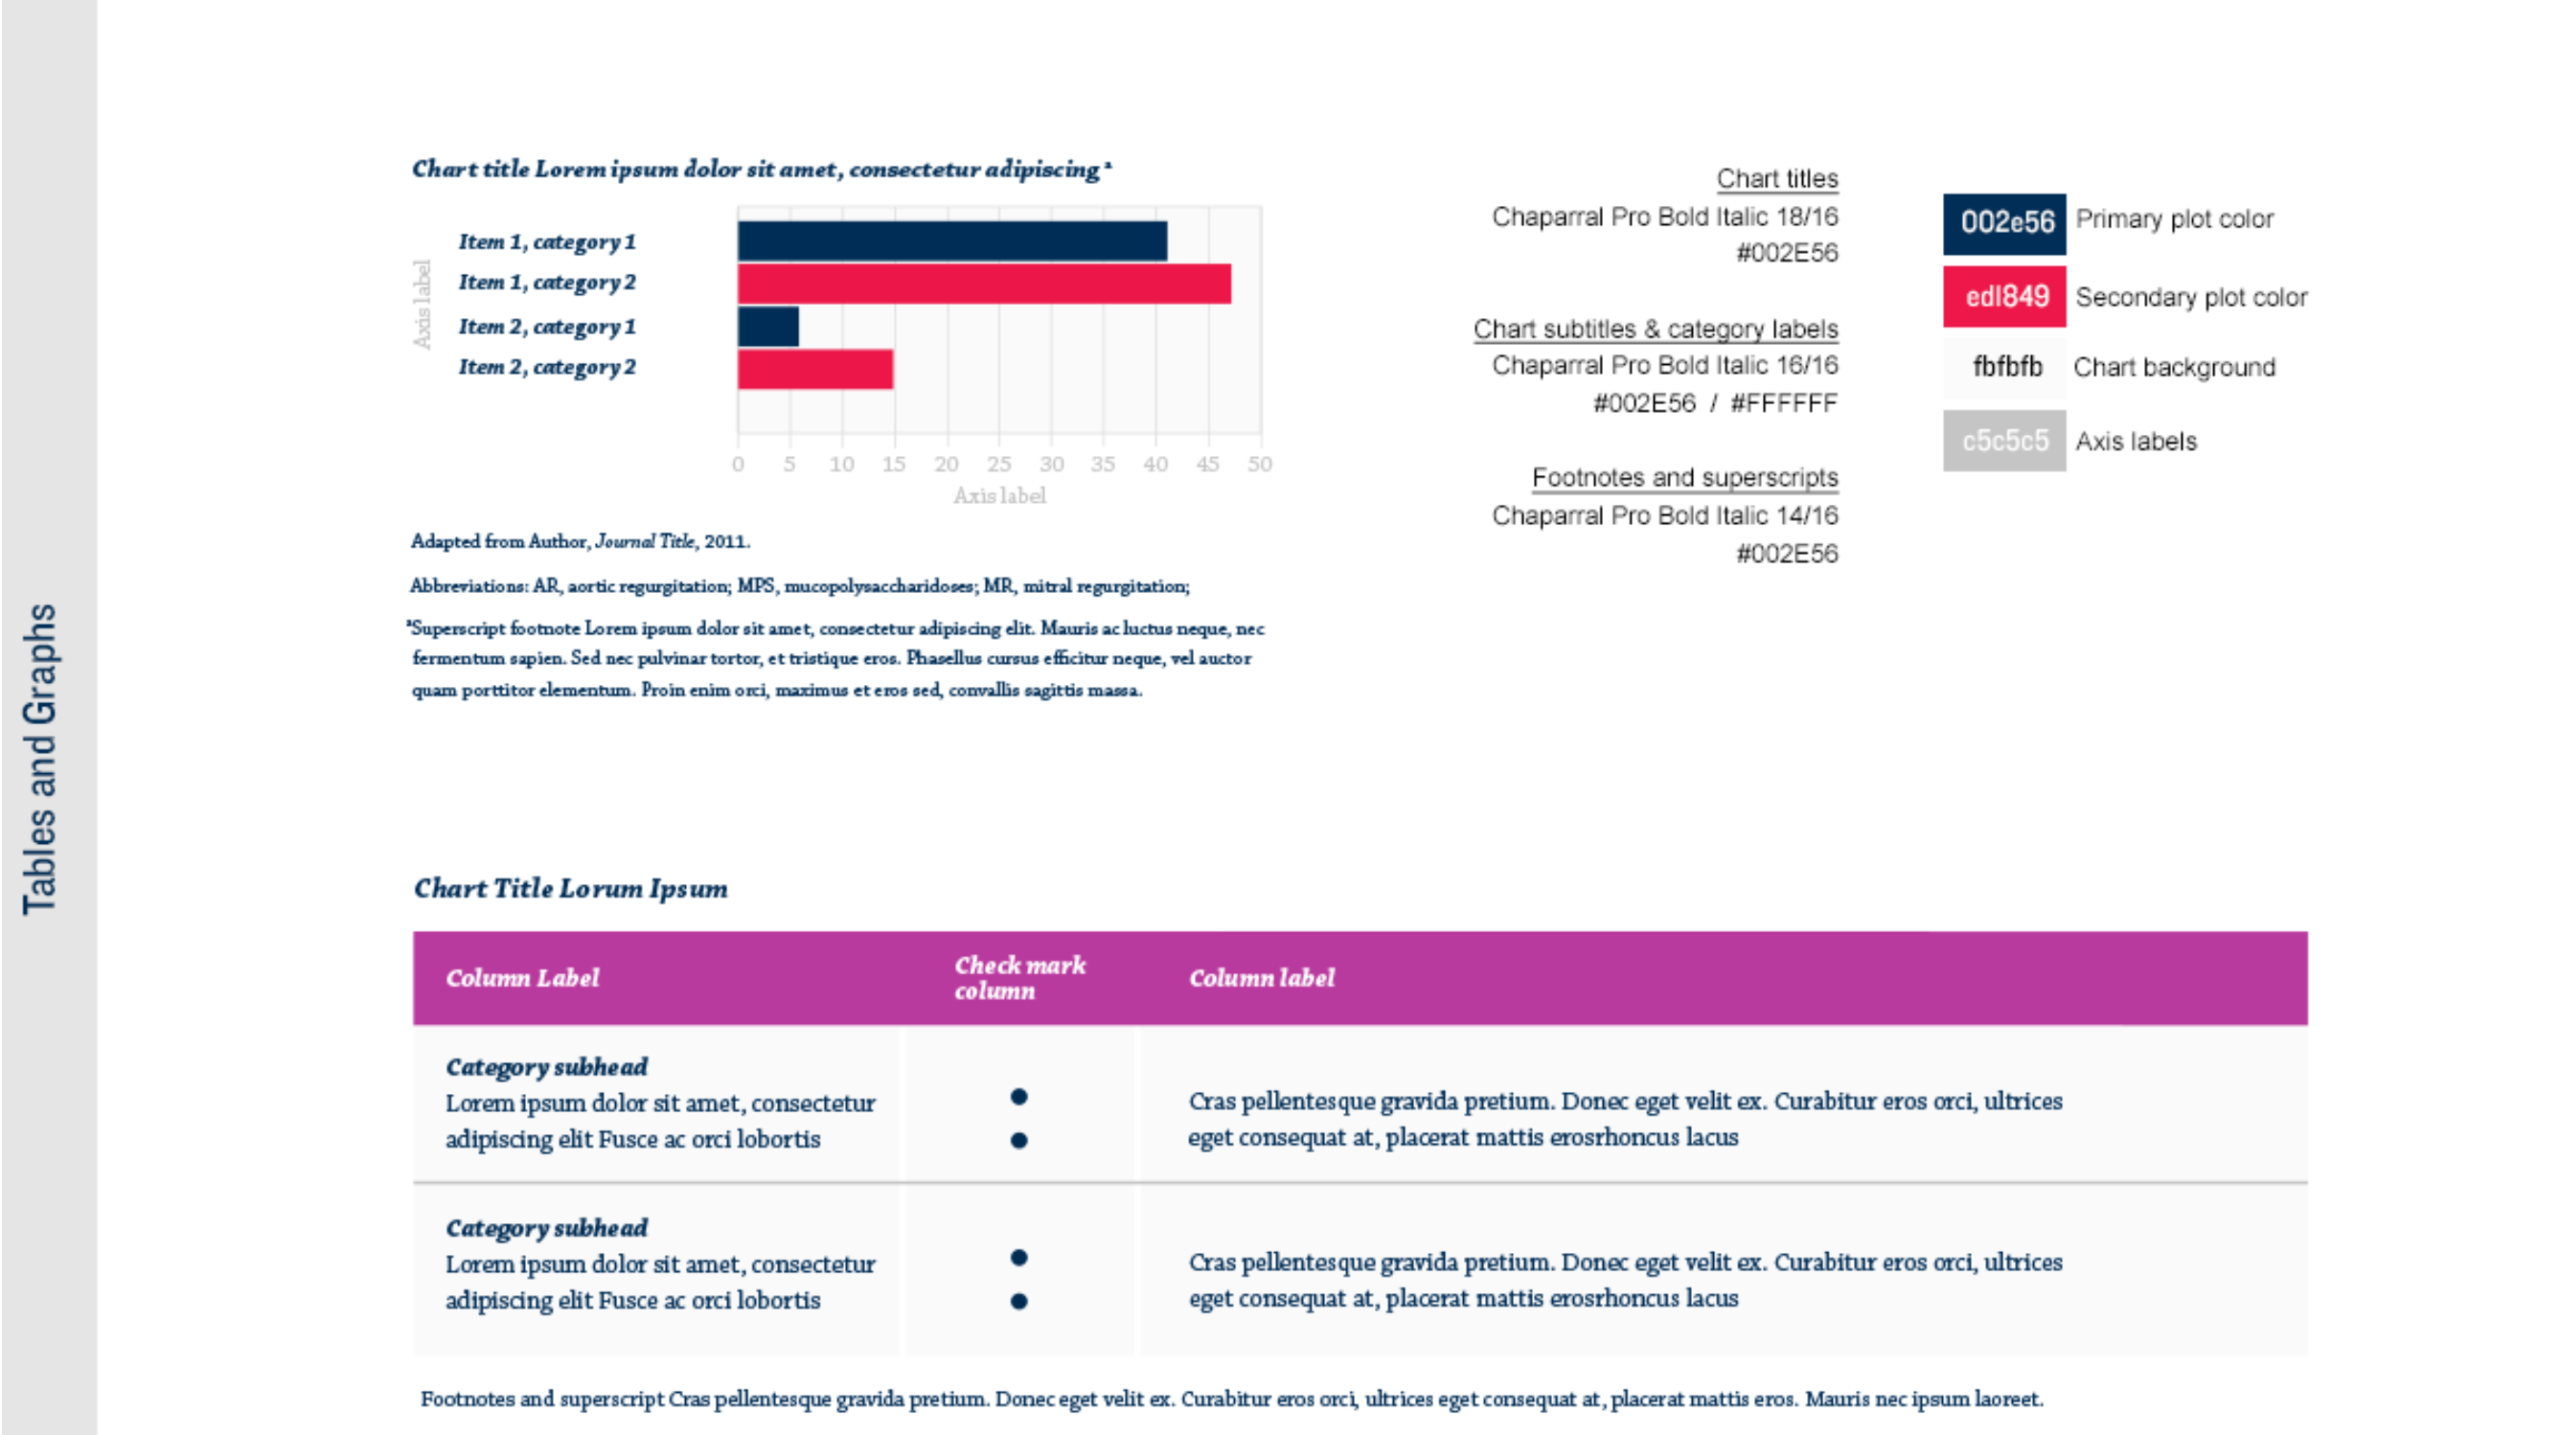
The charts are the interface. Every patient stays a dot, the MPS percentile curves are the reference, and the gap between them is the finding. A callout below states the clinical takeaway in one sentence.
The deviation reads at a glance, with no statistics required.
Lists of symptoms, or a body you can point at?
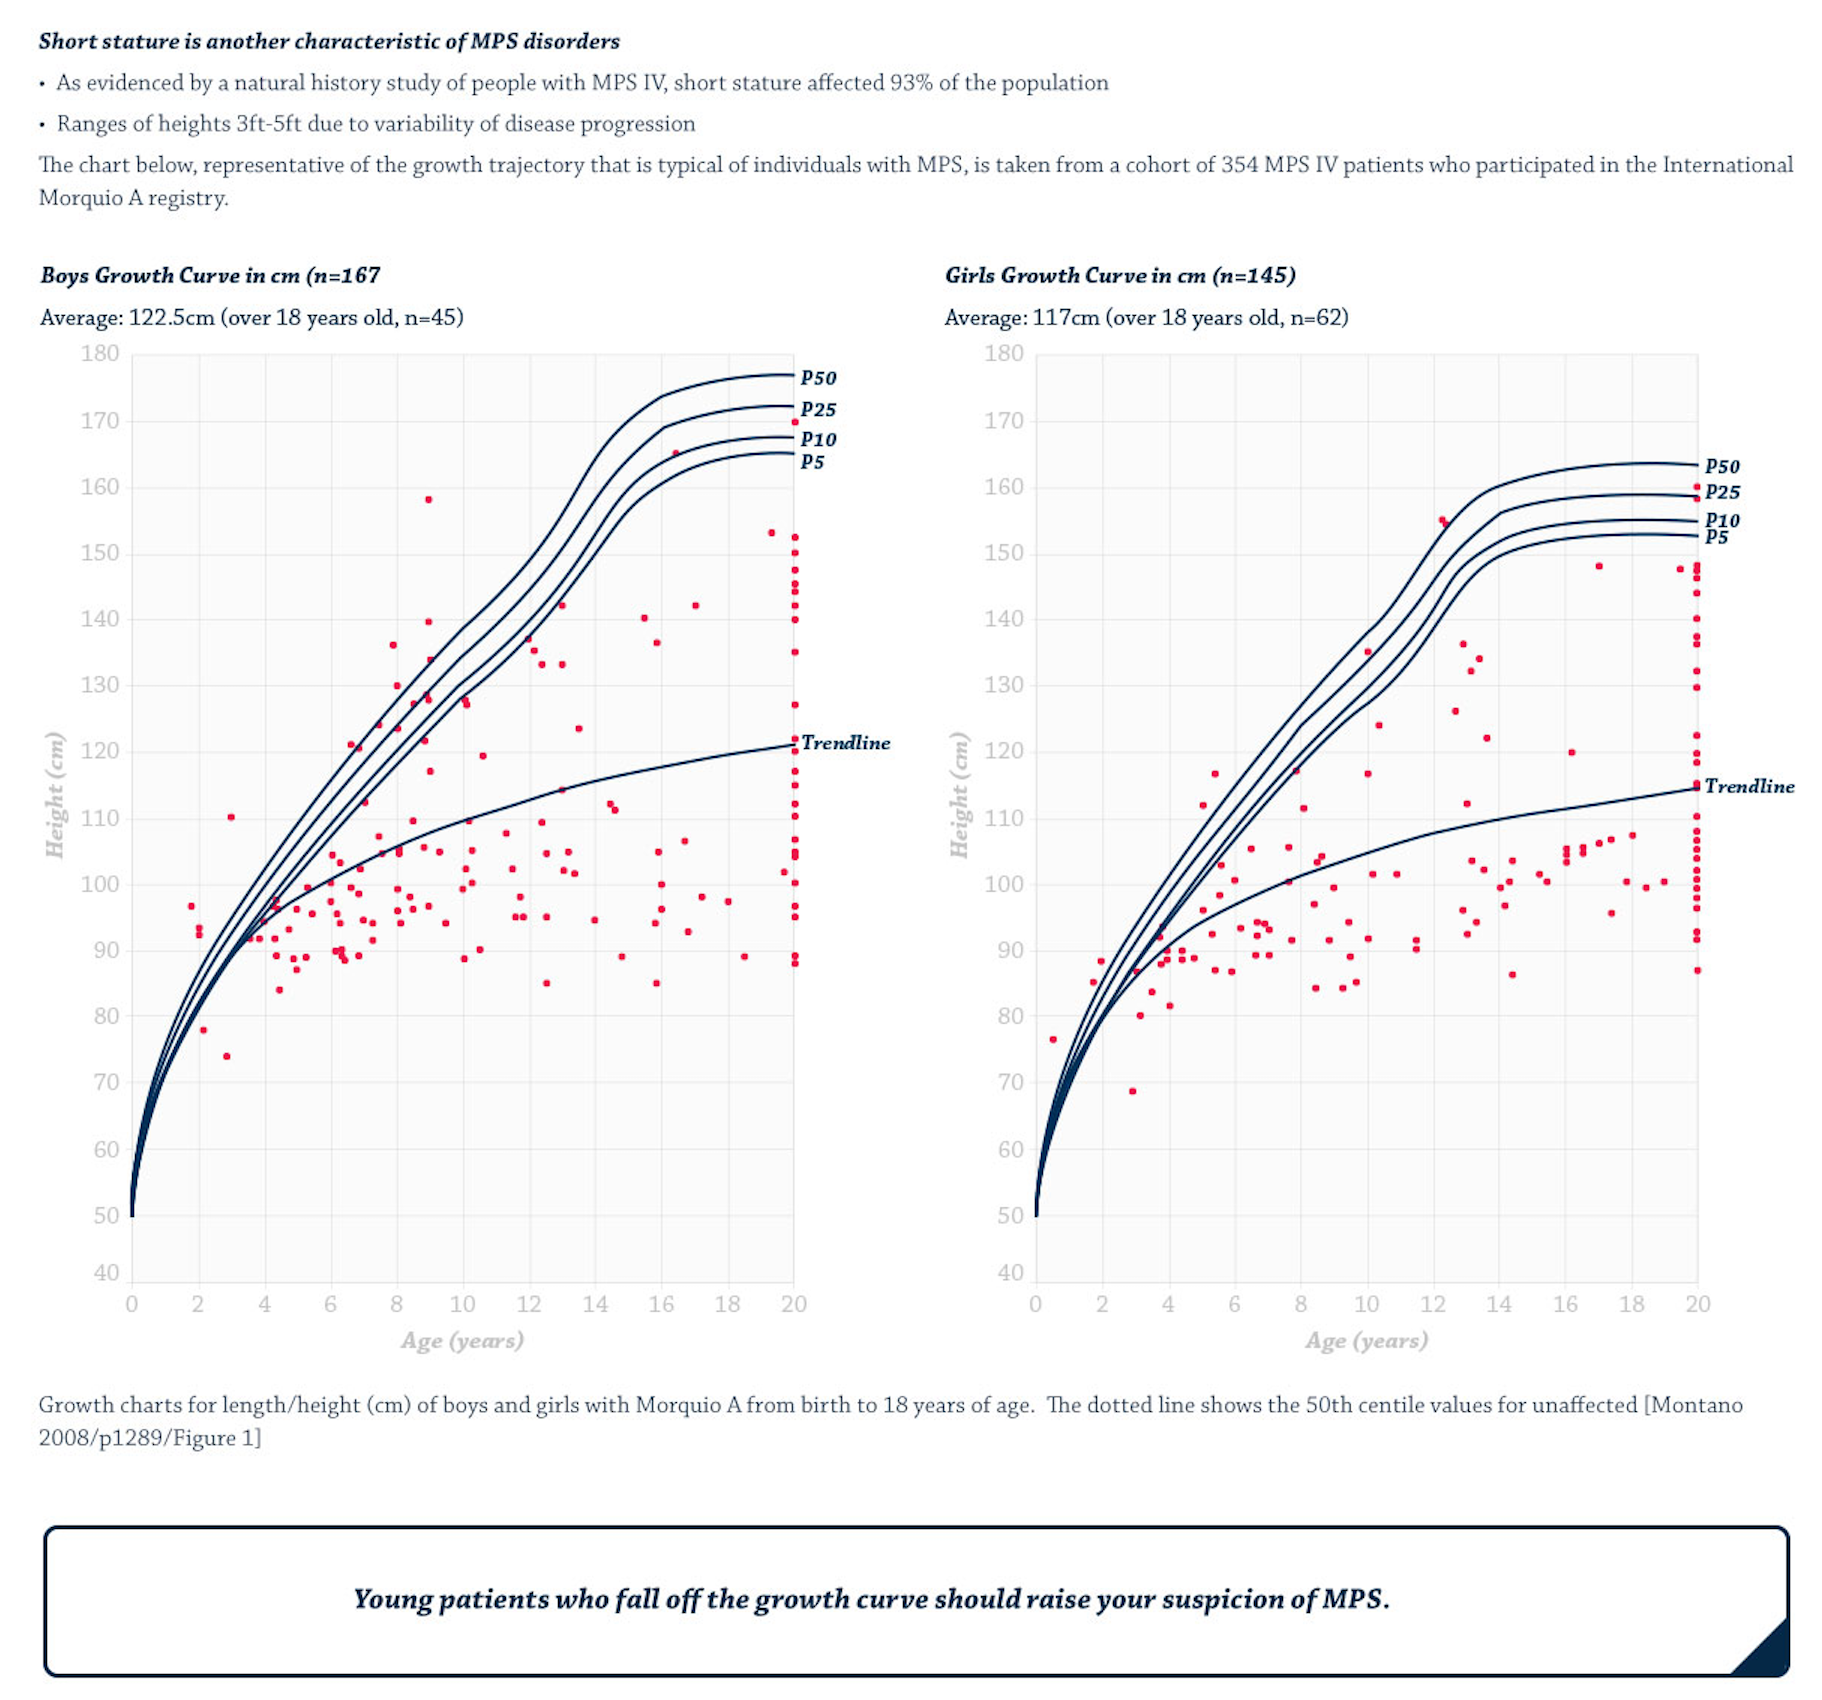
A body you can point at. Readers pick a system, from musculoskeletal to neurologic, and the page opens that system's manifestations with clinical images, so they drill into detail only when they need it.
Pattern recognition comes before terminology.
04 · The solution
One style guide, carried through every page.
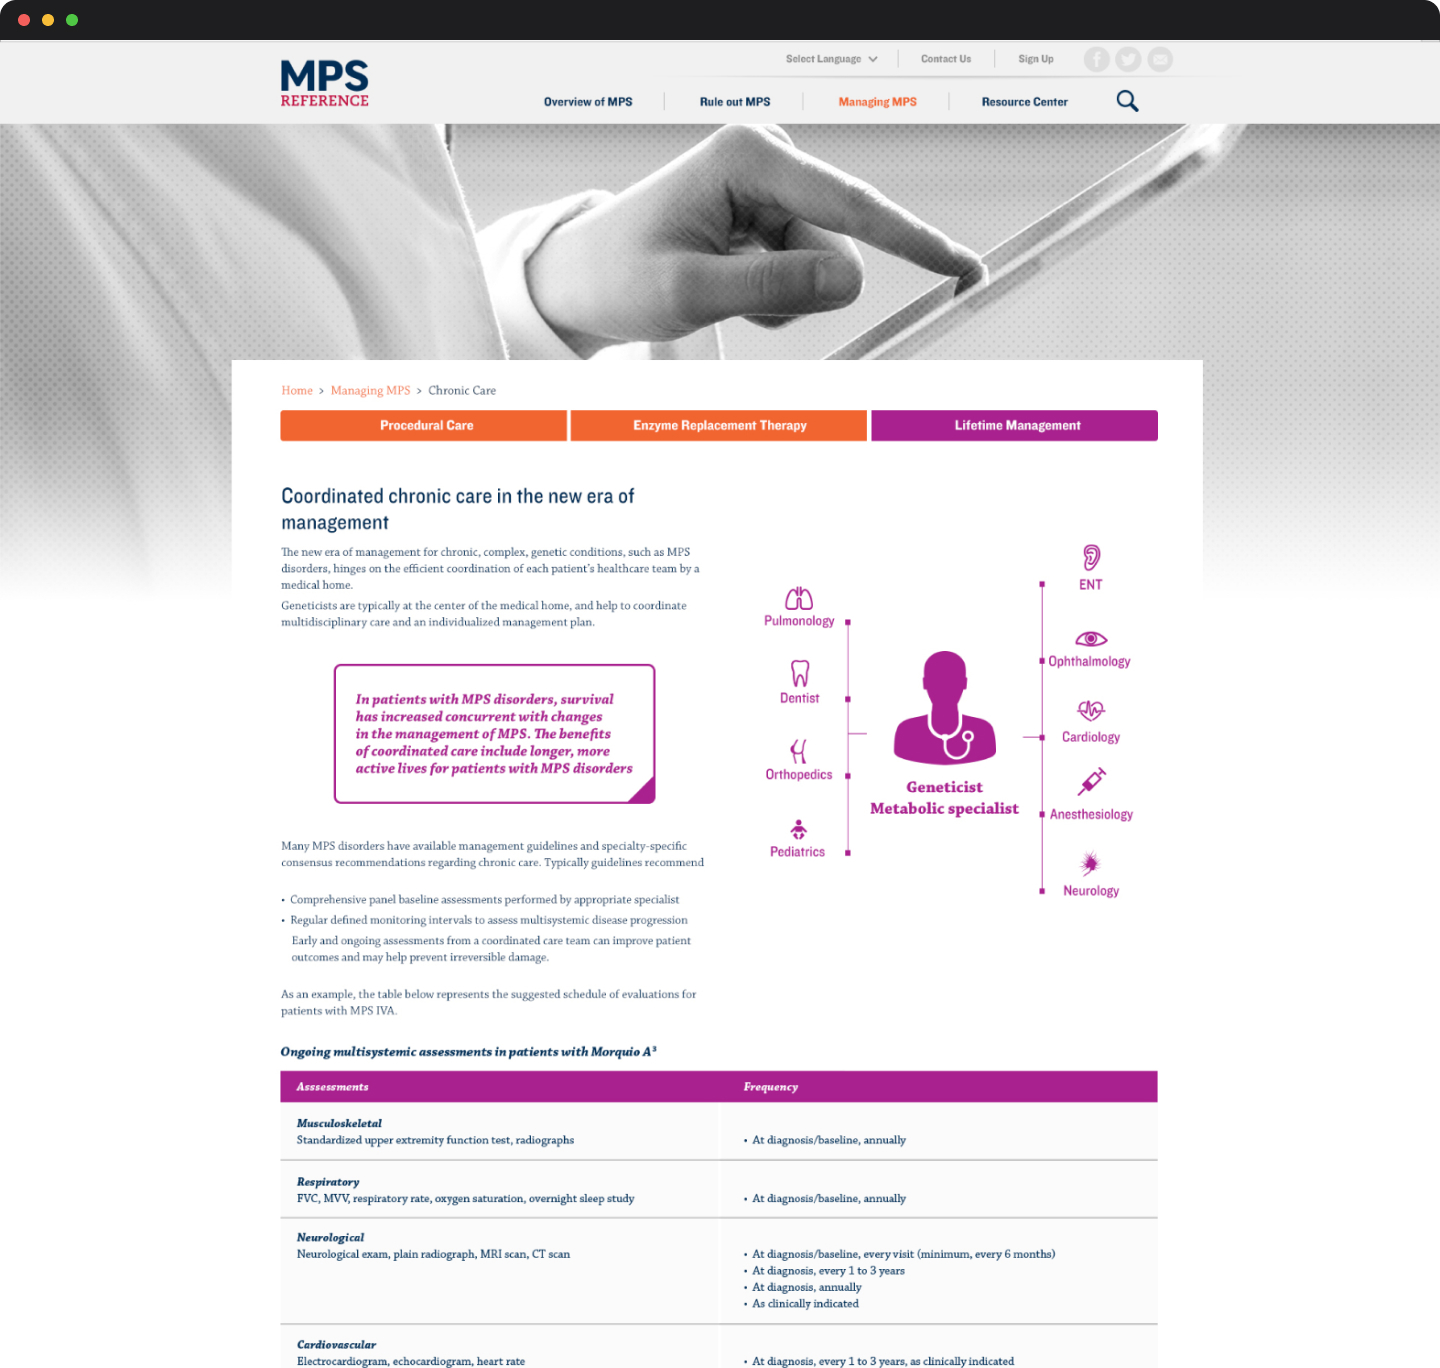 Guide parts 3 and 4
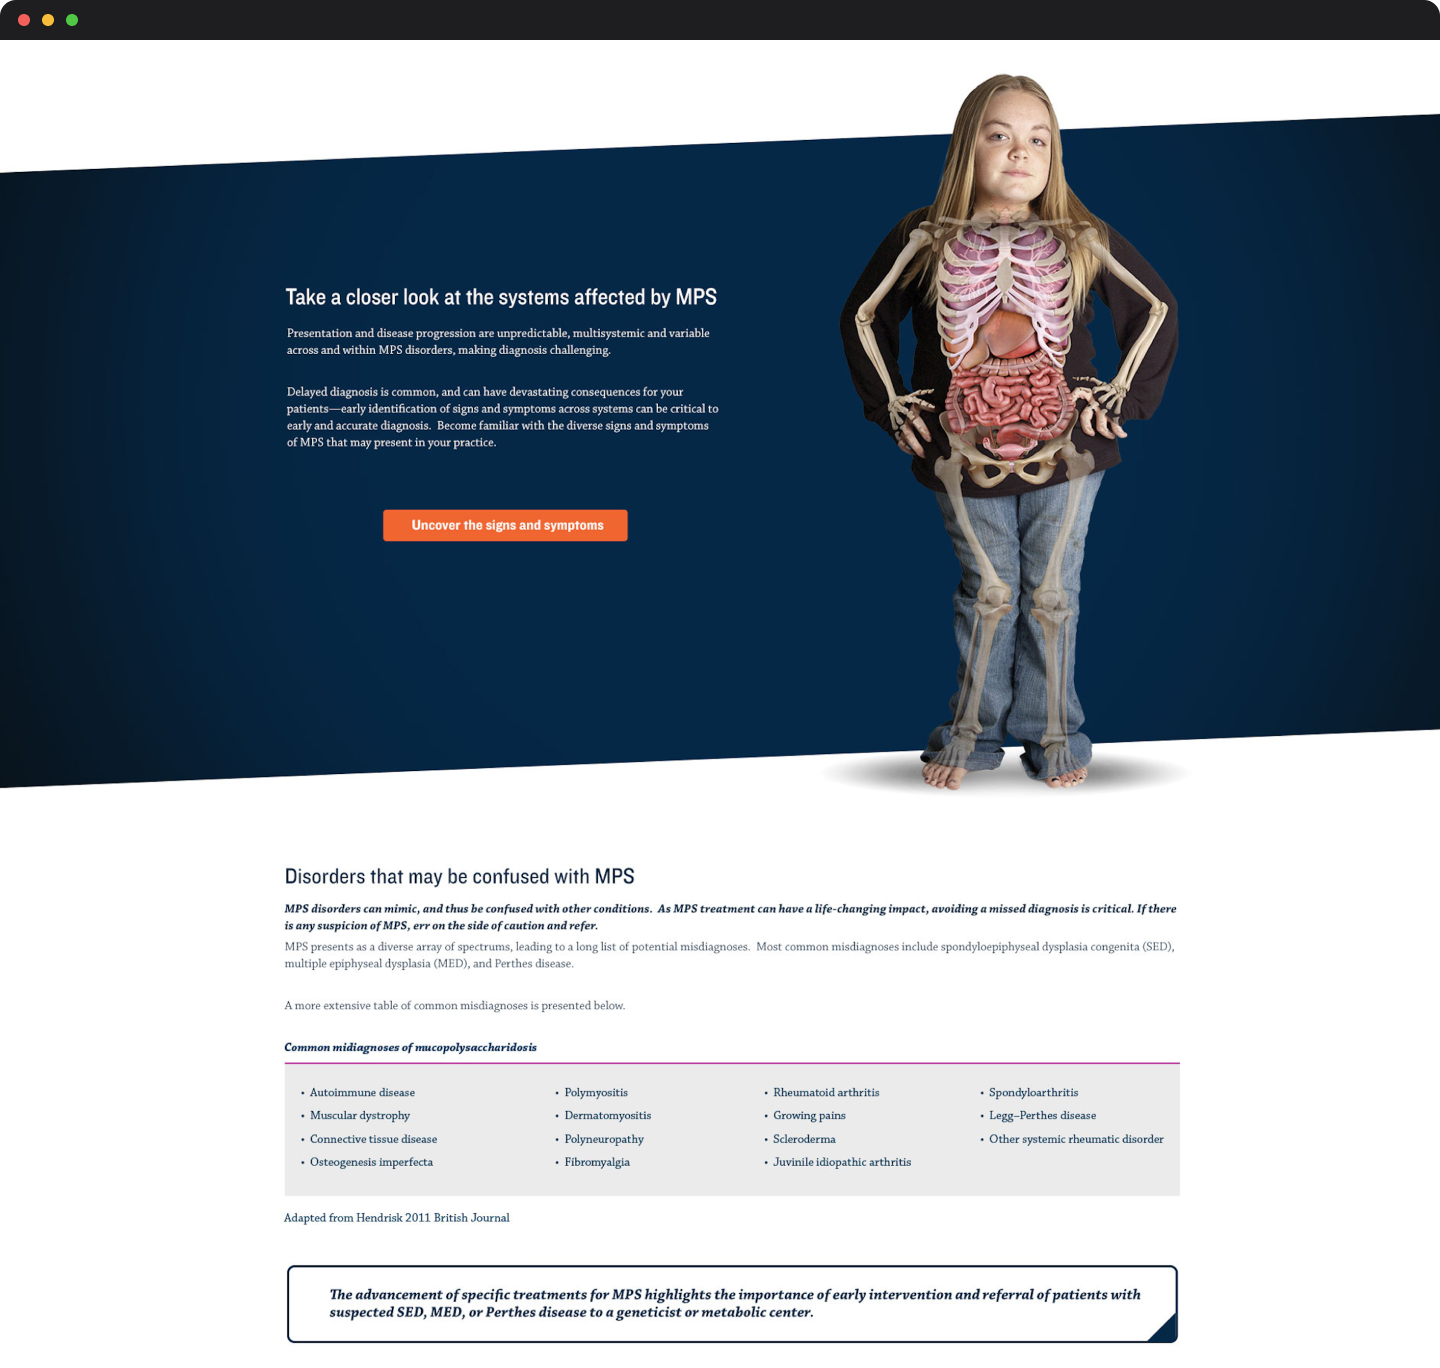 Guide parts 2 and 4
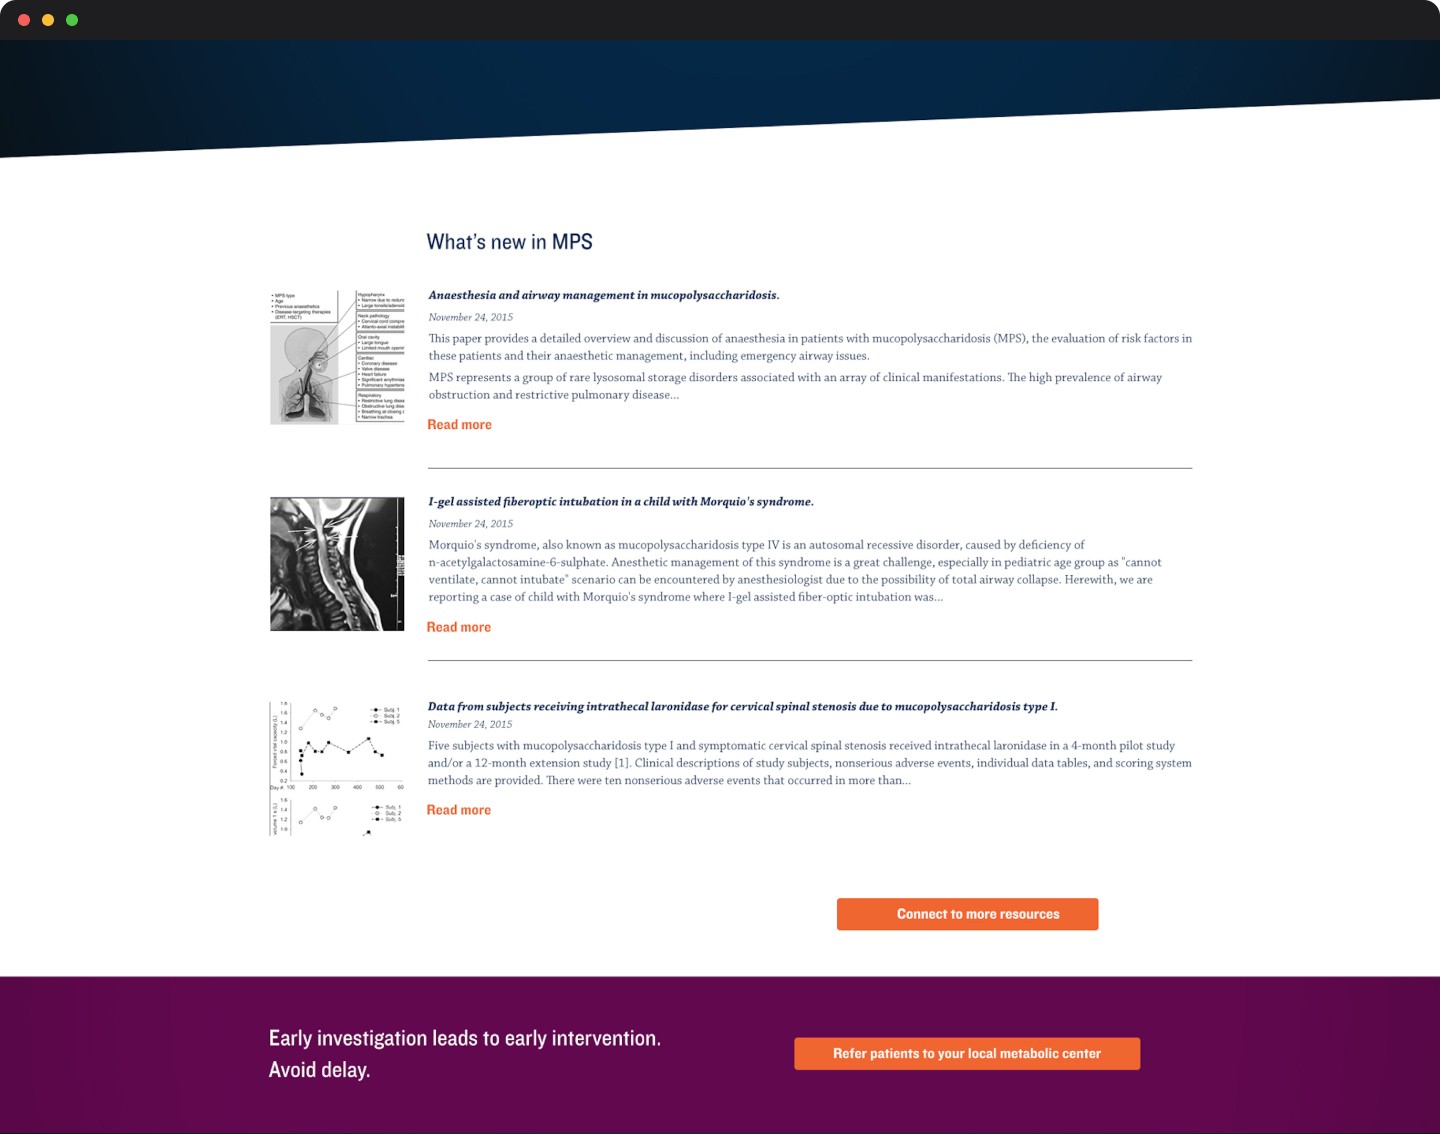 Guide parts 2 and 4
05 · Outcome
What changed for the people reading it
First thing readers see
Trends
was paragraphs
Readers see what is happening before they are asked to read about it.
Reading a chart
Learn once
was relearn each one
Shared rules for titles, color and axes carry across every chart and table.
Finding a symptom
Point at it
was scan a list
The body illustration narrows the page to the right system.
Specialty wayfinding
9 icons
each with its own color
Every specialty is recognizable on every page, from the care hub to the tables.
Described from the style guide and page designs. Not production analytics.
06 · Reflection
A visual foundation that scales with the science.
The style guide gave the site a clear, structured reference experience that made rare disease data easier to interpret on any device. Because it was a system, not a set of pages, it could grow as new diagnoses and data sets were added.
I still work this way on complex systems: design for decisions made under uncertainty, choose clarity over completeness, and treat data presentation as a core UX problem, not a visual afterthought.
